
Faculty
Dr. Michael Myers
Associate Professor of Petroleum Engineering
Dr. Lori Hathon
Assistant Professor of Petroleum Engineering
Laboratory Capabilities
- Micro‐CT Imaging
- Thin Section (Transmitted, Reflected, Fluorescent light)
- X‐Ray Diffraction (XRD)
- Raman Microscopy
- SEM Imaging – Backscattered and Secondary Electron, Energy Dispersive Spectroscopy, Scanning Cathodoluminescence
- Quantitative Petrographic Interpretation (QPI) Software
- Aizen Data Hub to Share and Analyze Large Images
- Acoustic Microscopy
- Ultrasonic Measurements
- Geomechanical measurements (Isostatic, uniaxial, triaxial testing)
- Porosity/permeability/grain density
- Nuclear Magnetic Resonance (NMR) Measurements
- Cation Exchange Capacity
- Electrical Property Measurement
- GC/MS
Digital Imaging - Integrated Analysis
The joint laboratories provide -
Integrated Multiscale Rock Property Characterization
- Laboratory measurements of porosity, permeability, pore volume compressibility, velocity, compressive strength, electrical properties (resistivity, dielectric properties), pore body and pore throat size distributions (NMR, MICP, and imaging), mineralogy and particle size distribution.
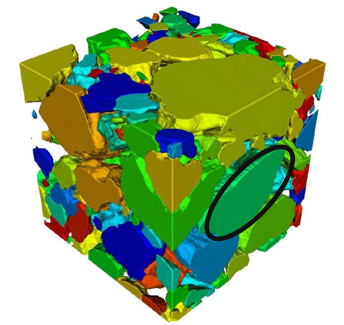
Digital Rock Physics
- Creation and application of novel multiscale and multimodal imaging and image analysis.
- Processing, analysis, management and archiving of digital image library, with remote access to cloud based digital image library from any location.
- Development of novel techniques and methodologies to allow efficient image analysis and digital computation on extremely large images.
Multiscale Modeling and integration
- Using registered 2D and 3D imaging of core plug samples, properties can be mapped to gray scales and up-scaled using CT imaging of whole core.
Analytics Digital Imaging Solutions
Cloud based image processing platform with the capability to catalogue, process and visualize very large image data sets.
Image Registration: 2D-3D
Allows integration of CT volumes with transmitted light and SEM imaging. Also applied to registration of FIB stack data. New algorithm developed to avoid the problem of local minima. Because thin sections are subject to plunging and rotation with respect to 3D volumes, most commercially available software cannot register 2D and 3D images adequately.
Statistics Acquisition
Grain Contact Identification for Acoustic Property Modeling
Image Filtering-NLM
Weighted average based on distances for all observed voxels to recover a single voxels
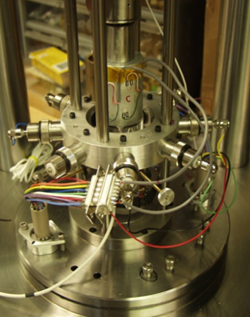
Rock Mechanics Measurements
Laboratory Highlights:
- Investigation of controls on static to dynamic correlations
- Anisotropy impact and role in formation properties
- Material Model to describe formation under Water Flooding
Azimuthal Anisotropy
The ring of transducers may be moved along the length of the plug to make multiple measurements (including oblique angles.)
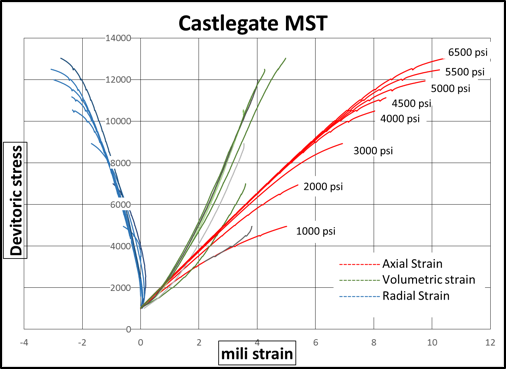
Multi-Stage Triaxial Test
The yield surface is measured using a single sample: saves core material and eliminates the twin problem. The results are corrected to maximum compressive strength with a simple multiplicative factor.
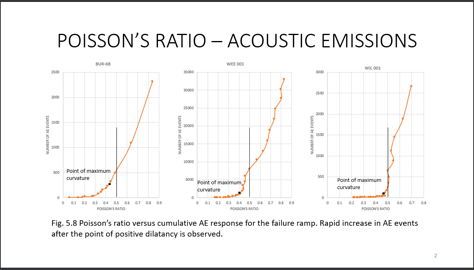
Poisson’s Ration - Acoustic Emissions
Choice of point of positive dilatancy as unloading point for multi stage triaxial tests is supported by AE studies.
Advanced Capabilities
- Four triaxial cells, one with future capability of whole core failure (250 kpsi axial stress, 20 kpsi confining pressure).
- Simultaneous measurement of static and dynamic properties
- Horizontal and vertical permeability.
- 1D Acoustic emission measurement
- Three operating resedimentation cells (three more in the near future)
Petrophysical Laboratory
Project and Capability Highlights:
- Dielectric constant properties as a function of salinity, saturation and temperature
- Two NMR spectrometers with gradient amplifiers (1D and 2D), with in-house inversion software.
- Archimedes and Boyle’s Law porosimetry and grain density
- Six isostatic cells for stressed P&P, F, Co-Cw measurement and thin section impregnation
- CEC measurements: Membrane potential, conductometric titration and methylene blue absorption
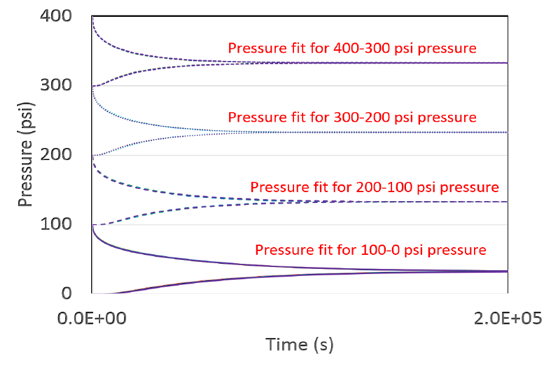
Transport Property Measurements
The curves are an overlay of models generated using nine sets of parameters. The k0-b plot for the COMSOL pulse decay model is shown to the right. They cross at the forward modeled values of k=10 nD and b=100 psi.
Future Capabilities
Sample equilibration at different levels of saturation while performing 3D characterization of the pore structure. Rock properties will be measured as a function of saturation and allow the estimation of capillary pressure curves.
Digital Imaging and Analysis
Axio-Imager .Z2M
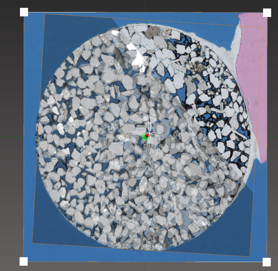
- Transmitted light microscope capable of scanning entire thin sections at high resolution and stitching the images together
- Scans routinely performed in plane light, cross polarized light at several angles of rotation, reflected light, and fluorescence.
- Allows local image analysis of individual fields of view to be put into the context of the larger sample.
In-house Image analysis software QPI (Quantitative Petrographic Interpretation; plug-in for Image J)
- Mineralogy (detrital and authigenic)
- Particle size distribution
- Grain contact statistics
- Strain Analysis
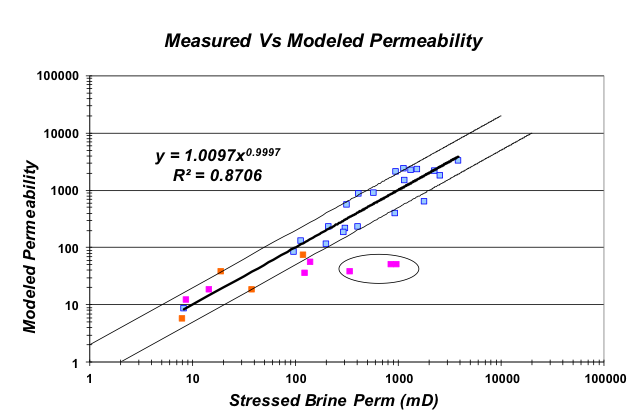
- Absolute permeability
Software Development and Modeling
Software Development
- Quantitative Petrographic Interpretation (QPI) Software
- Aizen: Cloud based image processing and image analysis
Modeling
- Permeability
- Velocity
- Compressibility
- Resistivity
- Dielectric constant
- Maximum Compressive Strength
- Static-Dynamic correlations